One of the most important things about your site, is how quickly it loads.
But getting an accurate report can be confusing, there are so many metrics and tools to look at that it can be both confusing and daunting.
So let’s break it down!
Tools of choice
My favourite tools for checking a site speed are GTMetrix and Pingdom Tools. In that order.
They give realistic reports on your site, test the loading speed from a location you can choose and GTMetrix in particular gives you some very useful metrics and tips on improving things. But it’s important to understand what the reports mean, so that you don’t waste an awful lot of time optimising things that don’t really matter.
So let’s go through using GTMetrix and how you should be reading the report.
Step 1 – Sign up to a free account
You can run a free report at https://gtmetrix.com/ without signing up, but you can’t change the server location, and if you’re not running the report from the same location as your customers, then the report isn’t going to be realistic or useful.
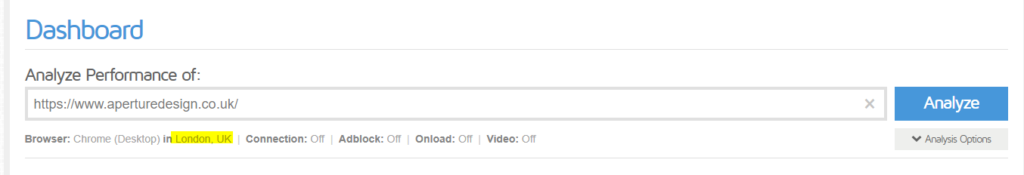
It’s still free, but having an account allows you to toggle the location of the test server by clicking on the location, highlighted in the screenshot below.
Note that I’ve used the full URL, including HTTPS, as this is the link that will appear in Google. Using another variation would give an unrealistic result, as it would include the forward to your visible address as the first step.
Step 2 – Analyze your results
Your report will run and come up with a screen looking like this
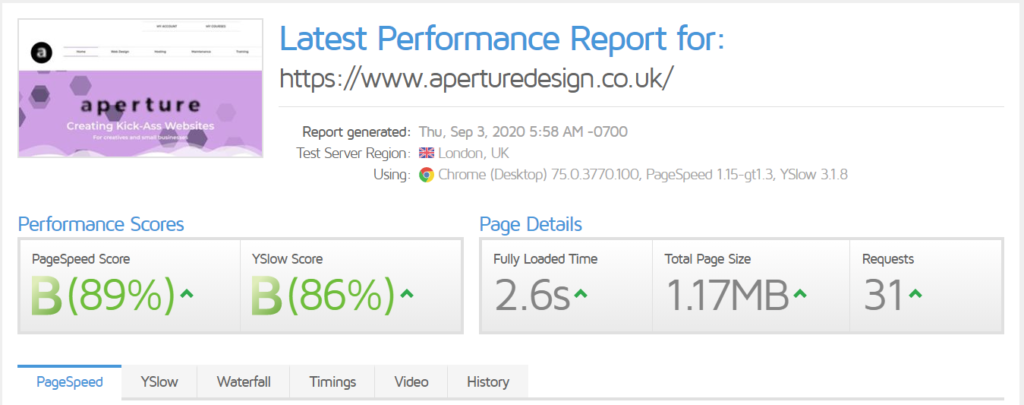
Now this is where people make a mistake and potentially a lot of work for themselves. It’s important to understand that both the Pagespeed Score and YSlow Score are *indicators* of what might be the issue *IF* your website is slow.
The important measures are contained within the Timings and Waterfall tab. With the PageSpeed tab giving you an indicator of what you might need to fix if it is slow.
Let’s start with Timings:
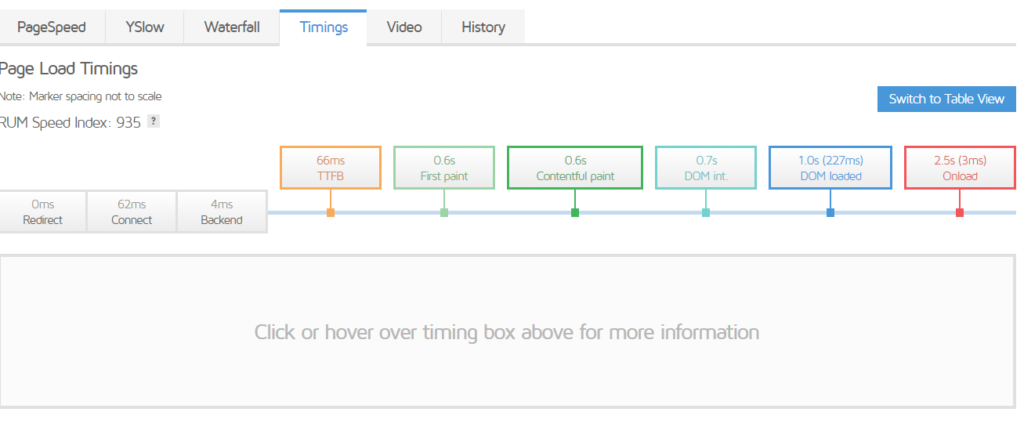
So the two most important measures here are:
TTFB – Time To First Byte: This is the time it takes for the server to start responding once a user puts your address in their browser. It’s a good indicator of your hosting, you want this to be as low as possible. Definitely under 0.5 seconds. If it’s higher than that, then you’re probably going to want to look at new hosting.
Contentful Paint: This is when the first visible elements of your website are loaded. The user can see something on the screen and they know the website is loading properly. Ideally you want this under 1.5 seconds. If your TTFB is low but your Contentful Paint is several seconds, this is when you’ll want to look at other potential issues (it *could* still be down to your hosting.
If this is all good, then you probably don’t need to worry. Unless your Fully Loaded time is very high, above 5 or 6 seconds. I wouldn’t worry too much *if* your contentful paint is fast enough. Some big sites will always take a few seconds for the whole page to load, and that’s generally fine. But if your page is only a couple of megabytes, and still taking 5 or 6 seconds to load, then you might want to drill down into that a bit further.
So what if you find a problem?
Ok, so you run your report and your loading time is too high. What now?
This is when I’d look at the PageSpeed, and Waterfall tabs. Let’s take PageSpeed first:
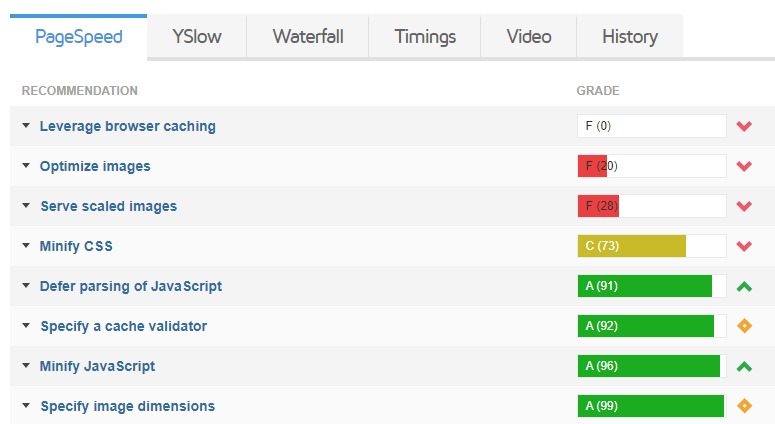
This report shows several potential issues that could be impacting speed. Let’s take a look at them in order, as these are typically the items that would show as being potential issues on this report.
Leverage Browser Caching: This can be an issue if your hosting isn’t set up properly to take advantage of browser caching, there’s several ways of taking care of this in WordPress, my favourite option is WP-Rocket (and this is included for free on my hosting).
But, it can show some false positives, if you expand this and look at the items within it, it may contain more than just files on your server. If you’re using Facebook Pixel, pulling images from Instagram or have Google Analytics running, then you’ll likely see files from those domains as well, such as this:
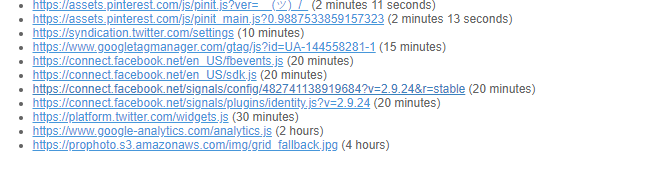
Let’s get this clear: These files are not on your website, and you cannot fix this “error”. The only way to avoid this, is to not use them. Clearly not an option for most of these. So if the only results in this section are from external resources, ignore them.
Optimize images: Expand this and will it show you the potential reduction in size you could get by further compressing your images. The score is related to the number of images that would benefit from further compression, and not the space saving. So on this report for example, despite it being rated F, it would only save a total of 105Kb. Which wouldn’t make any meaningful difference to loading times.
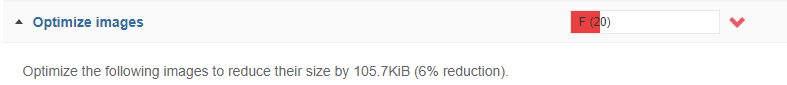
So in this instance, I would once again, ignore the score. If it was 0.5Mb or upwards, then I’d probably do something about it.
Serve Scaled Images: This is similar to the above. The difference being that this refers to images of different pixel dimensions, resizing images on load takes longer than serving the correctly sized image in the first place. Again I’d look at how much space you’d save by resizing them before putting any effort in, in this instance:
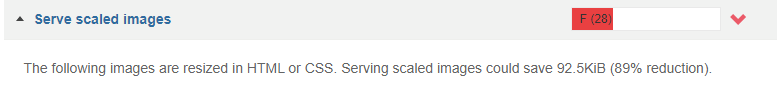
Fixing them all would save under 100kb. Again making no difference to the loading time. So you can spend all that time improving your score, for your page to not load any faster at all. Now if you have an image that’s 6000px wide but only displaying it 500px wide, that’s going to cause issues! But if you’re resizing it from 1000px wide to 500px wide, then that’s probably not an issue.
This comes with a bit of a caveat: Sometimes to score highly on this measure, you’re going to need multiple copies of the same image. You might use the image once full-width on a page, and again as a tile on your homepage. It’s then up to you what you do, I tend to use the same image for both, sized at 2000px wide and 75% quality. Because it’s less work and my hosting is fast enough to just not worry about it too much.
The Waterfall
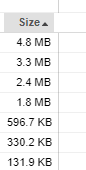
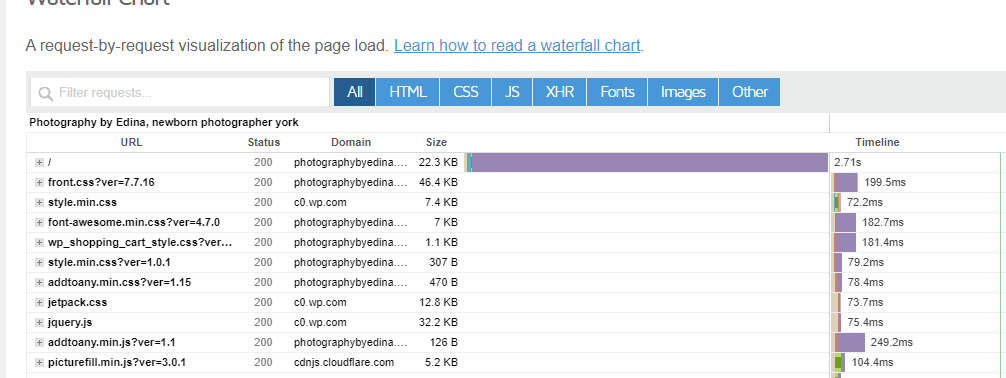
The waterfall is the last bit I’ll use for diagnosing speed issues. Large blocks of purple preventing things from loading are the issue. You can also re-order it by size to see which images are taking up the most space and prioritise your re-sizing that way. For example on this report, you can see that the top 4 images definitely need resizing:
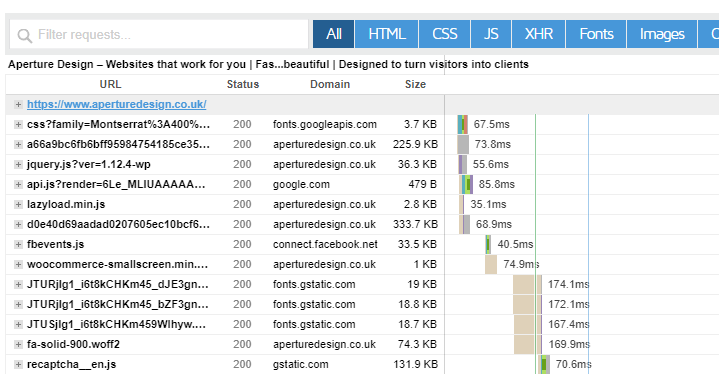
And in this one, the initial load of the domain ( The TTFB) is causing the issue:
And a healthy waterfall might look like this:
In Conclusion
The score doesn’t matter, loading times do.
The Fully Loaded time is less important than the Contentful Paint.
Hosting can be a large part of the issue, and good hosting can allow you to get away with bigger images without impacting loading times.
Any questions? Any issues you need help with? Drop a comment below and I’ll help as best I can!


0 Comments